.webp)
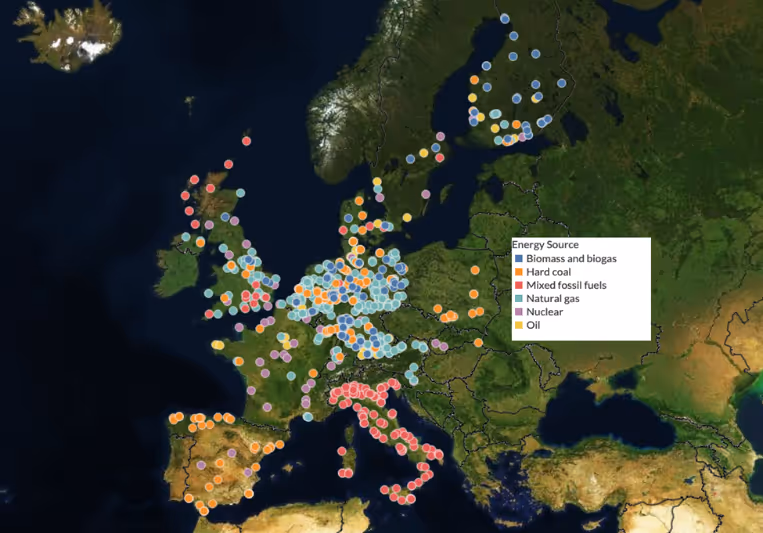
Based upon data from the Open Power System Data Platform and Jupiter’s ClimateScore model, the study assessed 748 conventional power plants for their exposure to acute heat, precipitation, and high winds in the IPCC SSP2-4.5 scenario.
The study defines extreme heat as a day where the temperature exceeds 35C. This threshold is used as an illustrative proxy and can be fine-tuned to better correspond to unique operating geographies or design standards.
Using these plants as representative coverage of the European power system, the study highlights the impact that these climate-related threats will have on energy infrastructure.
The Findings
Three crucial results of the research are important to highlight.
- The average exposure to acute heat is projected to increase significantly.
- There will be a moderate projected increase in average exposure to extreme precipitation.
- There will be a projected decrease in average exposure to extreme wind speeds.
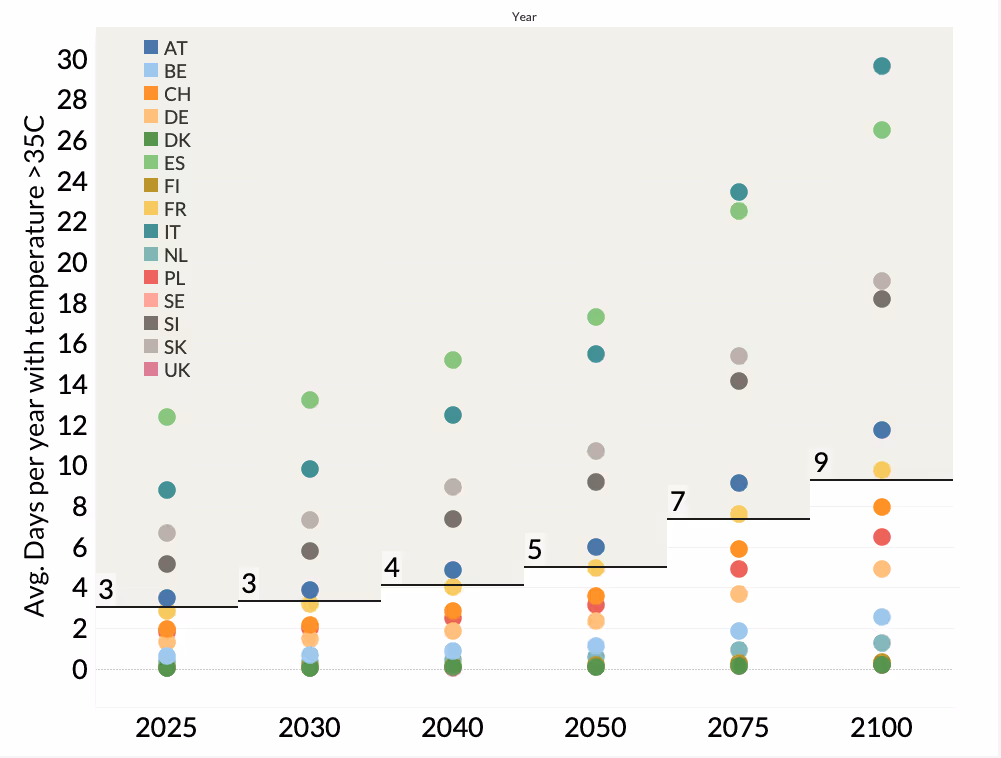
Extreme Heat
The table below captures the average number of days exceeding 35C across the sampled conventional power plants in SSP2-4.5. This analysis does not consider natural variability: the fact that some years will inevitably present higher levels of acute heat risk than what is modeled on average in Europe. We observe a near-doubling of acute heat risk in the span of the next 3-4 decades.

These conclusions are consistent with the IPCC’s Sixth Assessment Report, which summarizes: “... Irrespective of the scenario, it is virtually certain that warming will continue in Europe, and there is high confidence that the observed increase in heat extremes is due to human activities. It is very likely that the frequency of heat extremes will increase over the 21st century with an increasing gradient toward the southern regions.”
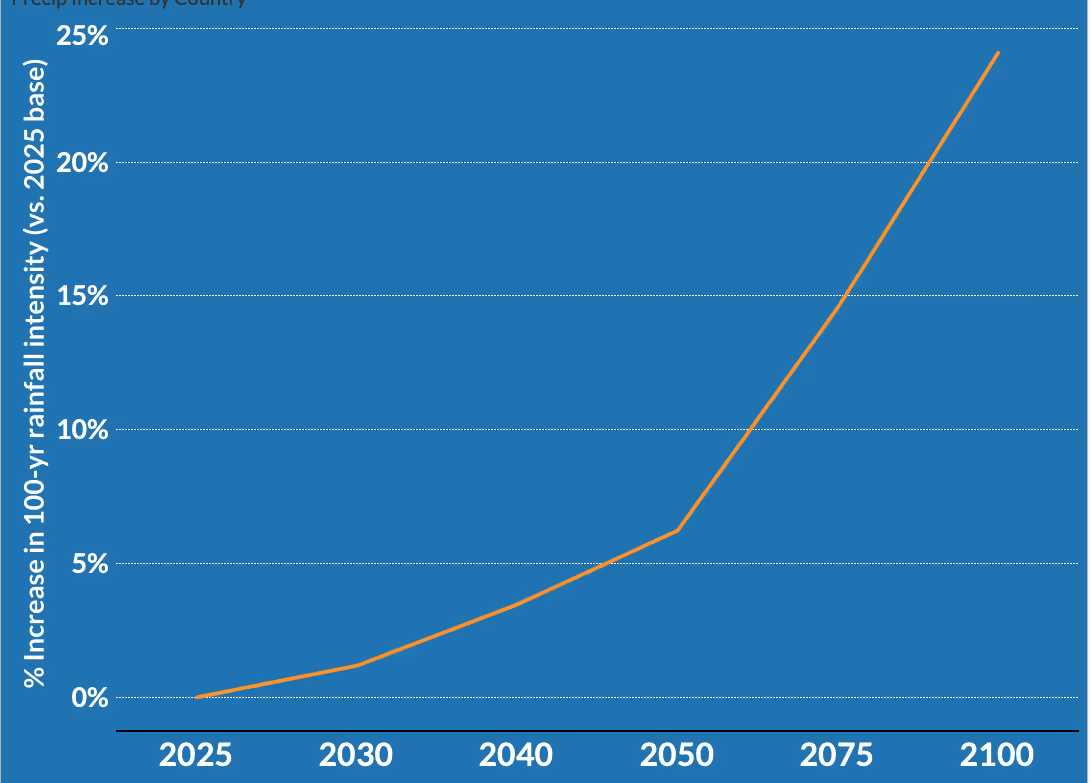
Acute Precipitation
The line graph below captures the average increase in precipitation event intensity in a 100-year event across the sampled 748 conventional power plants in SSP2-4.5, compared to a 2025 baseline. We notice a very material inflection point beyond 2050, where intensity starts to rapidly pick up and reaches almost 25% by 2100.
This is consistent with the conclusions of the IPCC’s Sixth Assessment, which states: “Projections based on multiple lines of evidence from global to convective permitting model scales show high confidence in extreme precipitation increase in the northern, central and eastern European regions (NEU, WCE, EEU) and in the Alpine area. Increases with medium confidence are projected for the Mediterranean basin (with a negative gradient towards the south) for mid- and end-century under RCP4.5, RCP8.5 and SSP5-8.5 and for 2°C GWL and higher (Section 11.9; MedECC, 2020).” [Source: IPCC AR6 WGI Chapter 12, Climate Change Information for Regional Impact and for Risk Assessment]
Acute Wind Speeds
The intensity of acute winds is not expected to materially change when averaged across the continent. However, projections of acute winds are subject to lower levels of confidence in the future when compared to hazards like extreme heat and precipitation, which benefit from higher levels of confidence. Mean wind speeds, however, are expected to somewhat decrease across the board, which could lead to implications for renewable wind operators, particularly those in offshore locations. This is consistent with a four-decade long trend of decreasing wind speeds in Europe.
Analysis of the Results
Breaking these results down by country leads to clear differences and variance, both in terms of total exposure and relative change across all perils.
The graph below shows the projected average number of days where the temperature exceeds 35C for conventional power plants across European countries.
We see that power plants in countries like Italy (IT) and Spain (ES) are significantly more exposed than the continental average (denoted as black line for each year). Power plants in France (yellow dot) consistently follow the European average. Finally, power plants in Germany, the Netherlands, and in the United Kingdom are below the continental average.
This analysis only tells part of the story, however, and drilling into asset-level assessment will yield powerful new sources of insights. For example, in the graph below, we’ve isolated nuclear power plants in France using the same visual paradigm.
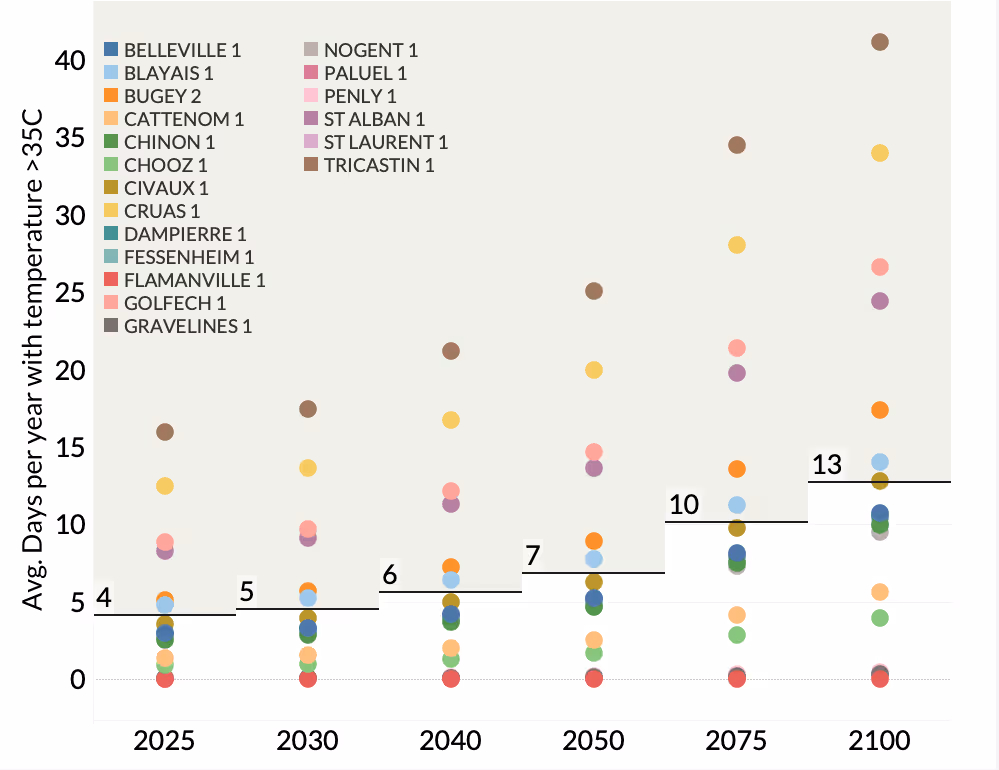
This view shows us that significant differences in heat exposures exist within a domestic cohort of assets. For example, by 2075, the Tricastin nuclear power plant faces more than 30 days of temperatures exceeding 35C, compared to the national French average of 10 days.
Finally, while country-level analysis is helpful, when drilling down into asset-level assessments, domestic portfolios can be segmented into:
- “Black Sheep” (high current exposure, high levels of future change)
- “White Elephants” (relative current exposure, low levels of future change)
- “Surprise Issues” (low current exposure, high levels of future change)
To bring this concept to life, we’ve assigned an “All Perils Score” to major nuclear power plants in Europe. As its name indicates, the “All Perils Score” is a composite score that takes into consideration multiple perils (flood, wind, wildfire, heat) to help with the segmentation approach presented above.
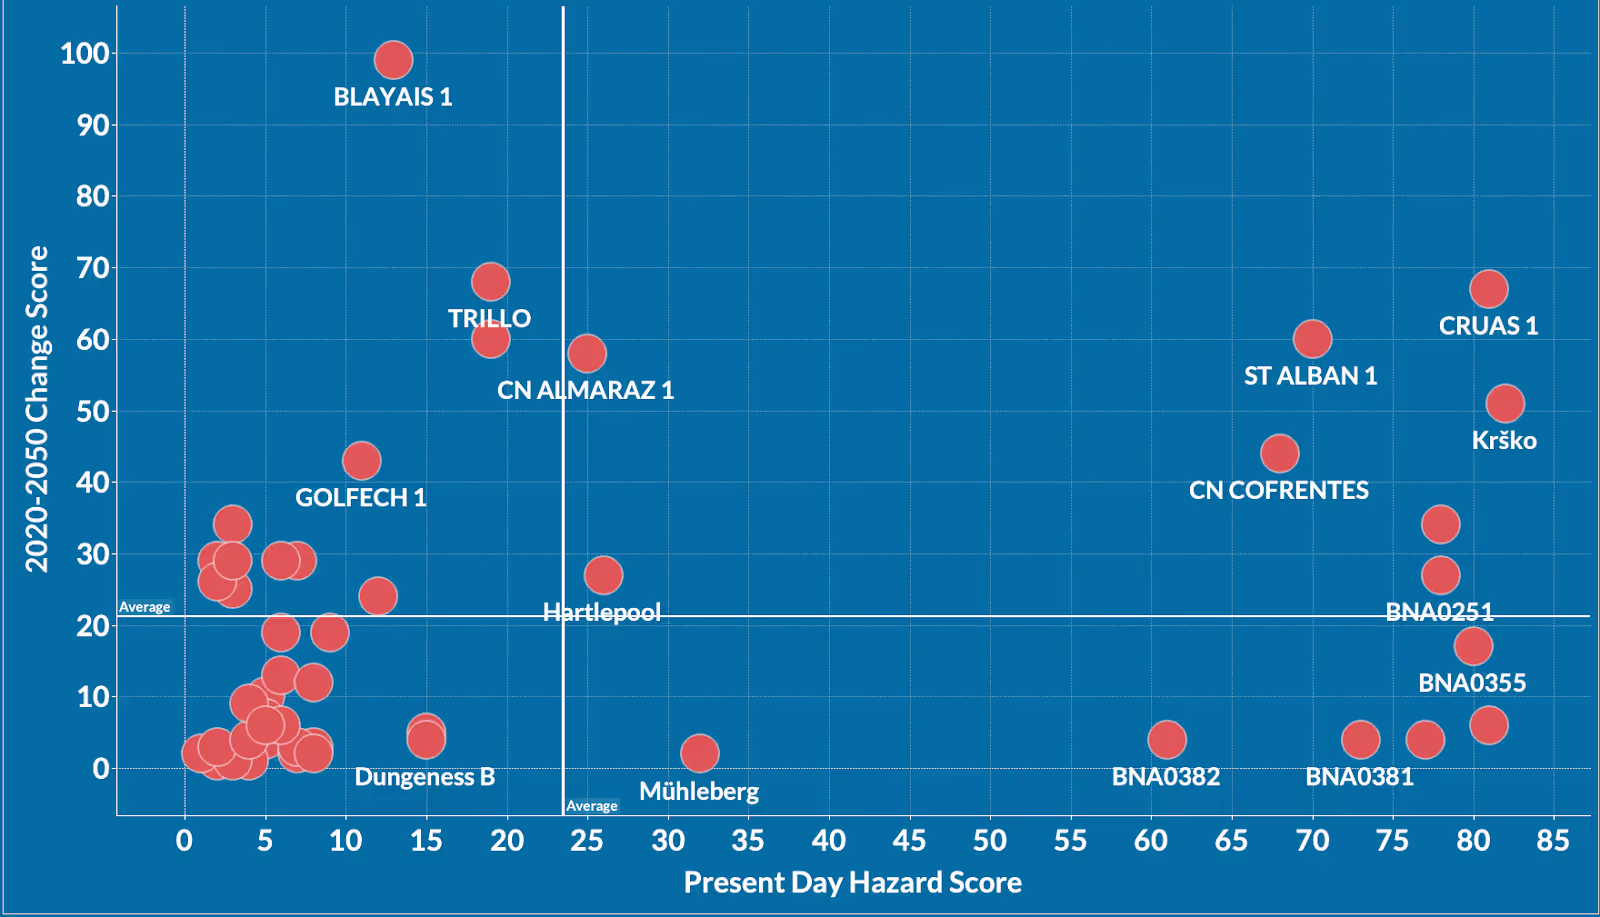
- In the bottom-right corner of the quadrant, we find our “White Elephants” (relative current exposure, low levels of future change). This segment is mostly made up of German power plants, which face relatively high levels of present-day flood risk (which presumably is mitigated against, something that this analysis does not seek to capture).
- In the top-right side of the quadrant, we find “Black Sheep” (high current exposure, high levels of future change). The quadrant is mostly composed of nuclear power plants in France and Spain, which suffer the “double whammy” of high present-day exposure and high levels of future change.
- In the top-left corner, we identify “Surprise Issues” (lower current exposure, high levels of future change), which again is mostly composed of nuclear assets in France and Spain.
Implications of this Study for Infrastructure Operators
Based on the experiences of both Jupiter and Guidehouse in working with infrastructure across the UK, the EU, and the US on climate resilience, what is notable is the pressing need to develop new processes for integrating climate risks into traditional investment planning. As an example, the current ARP process (Adaptation Reporting Power—with the fourth round underway at present for UK infrastructure) requires operators to qualitatively identify climate risks on an asset-by-asset basis and deliver proposals for adapting to climate change. However, for transmission and distribution networks, no standards yet exist for integrating quantitative measurements of these risks.
The findings above highlight the significant changes ahead that confront asset operators across Europe, and the increase in new threats for locations that may be currently unprepared to deal with them. Infrastructure operators need to understand both the threats specific to their portfolio of assets, and the expected levels of change they will experience on an asset-by-asset basis. Only with information at this level of granularity will they be able to justify the investments needed to protect their assets from the significant increases in vulnerability that we’ll see over the coming years.
If you would like to speak to a Jupiter Intelligence climate expert, please contact us here.
